Our Automated Test Bench is Live
- Alexander Grabowski
- Engineering
- March 11, 2026
Table of Contents
One of the biggest bottlenecks in power electronics R&D is testing. Manually sweeping through voltage and current setpoints, recording readings, and calculating efficiency at each operating point is slow, error-prone, and mind-numbing. So we automated it.
The Setup
Our test bench uses three instruments controlled via SCPI over GPIB and USB:
- ITECH IT6532D programmable power supply — simulates solar panel output at configurable voltage/current setpoints
- Prodigit 3366G programmable electronic load — draws configurable load current for sweep testing
- HIOKI 3193-10 power analyzer — measures input and output power simultaneously for real-time efficiency calculation
The system automatically steps through a matrix of input voltages and output currents, recording efficiency at every operating point. The result is a complete efficiency map of the converter across its full range — something that would take hours of manual measurement now runs unattended.
Built with Claude
We developed the entire software stack with the help of Claude — from the individual instrument drivers to the test orchestration layer. No open-source SCPI drivers existed for these instruments before we wrote them. Everything is published on our Gitea instance:
| Repository | Description |
|---|---|
| IT6500D | SCPI driver for ITECH IT6500D series power supplies |
| PRODIGIT-3366G | SCPI driver for Prodigit 3366G electronic load |
| HIOKI-3193-10 | SCPI driver for HIOKI 3193-10 power analyzer |
| mppt-testbench | Automated test bench orchestrator |
Anyone with the same instruments can use these drivers and test procedures — that’s the point of open-source.
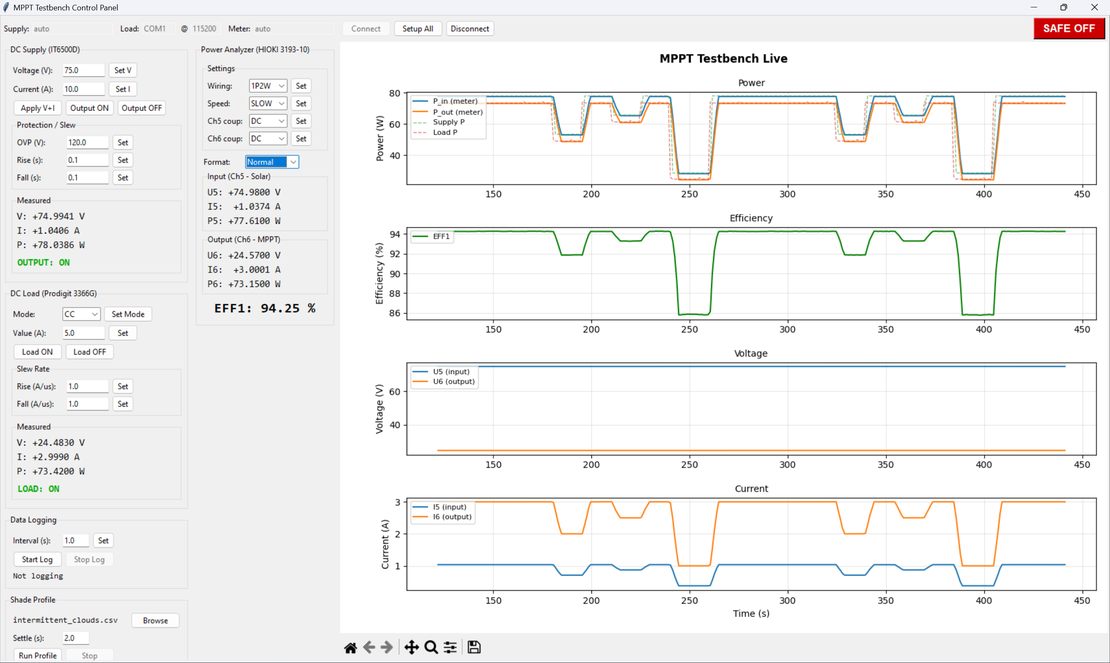
Test Bench Control Panel

The control panel gives us real-time visibility into power, efficiency, voltage, and current across both input (solar simulation) and output (load) sides. We can run automated sweeps, shade profile simulations, and log data — all from one interface.
Measured Efficiency

Our automated sweep at 60V input shows the LVSolarBuck hitting 97.96% peak efficiency at 330W — and staying above 97% across most of the operating range. This is measured, not simulated.
Current Status: LVSolarBuck
We’re currently using the test bench to characterize the LVSolarBuck — our 24V DC version of the MPPT charger. The automated sweeps are giving us precise efficiency data across different load levels and input voltages, which feeds directly back into design iteration and MPPT algorithm tuning.
Right now we’re limited on power levels — we’re waiting on a heatsink for the current design before we can push into higher power testing. Once that arrives, we’ll be able to map efficiency across the full operating envelope.
What’s Next
The 48V version of the MPPT charger is on the horizon. The beauty of having the test bench automated is that when the 48V board is ready, we can run the same comprehensive characterization with minimal setup changes. The tooling scales with us.
This is a good example of how investing in test infrastructure early pays off. Building the drivers and automation took time upfront, but every prototype revision from here on gets a complete efficiency map for free.