Rewriting the Ping River Monitor, Bit for Bit
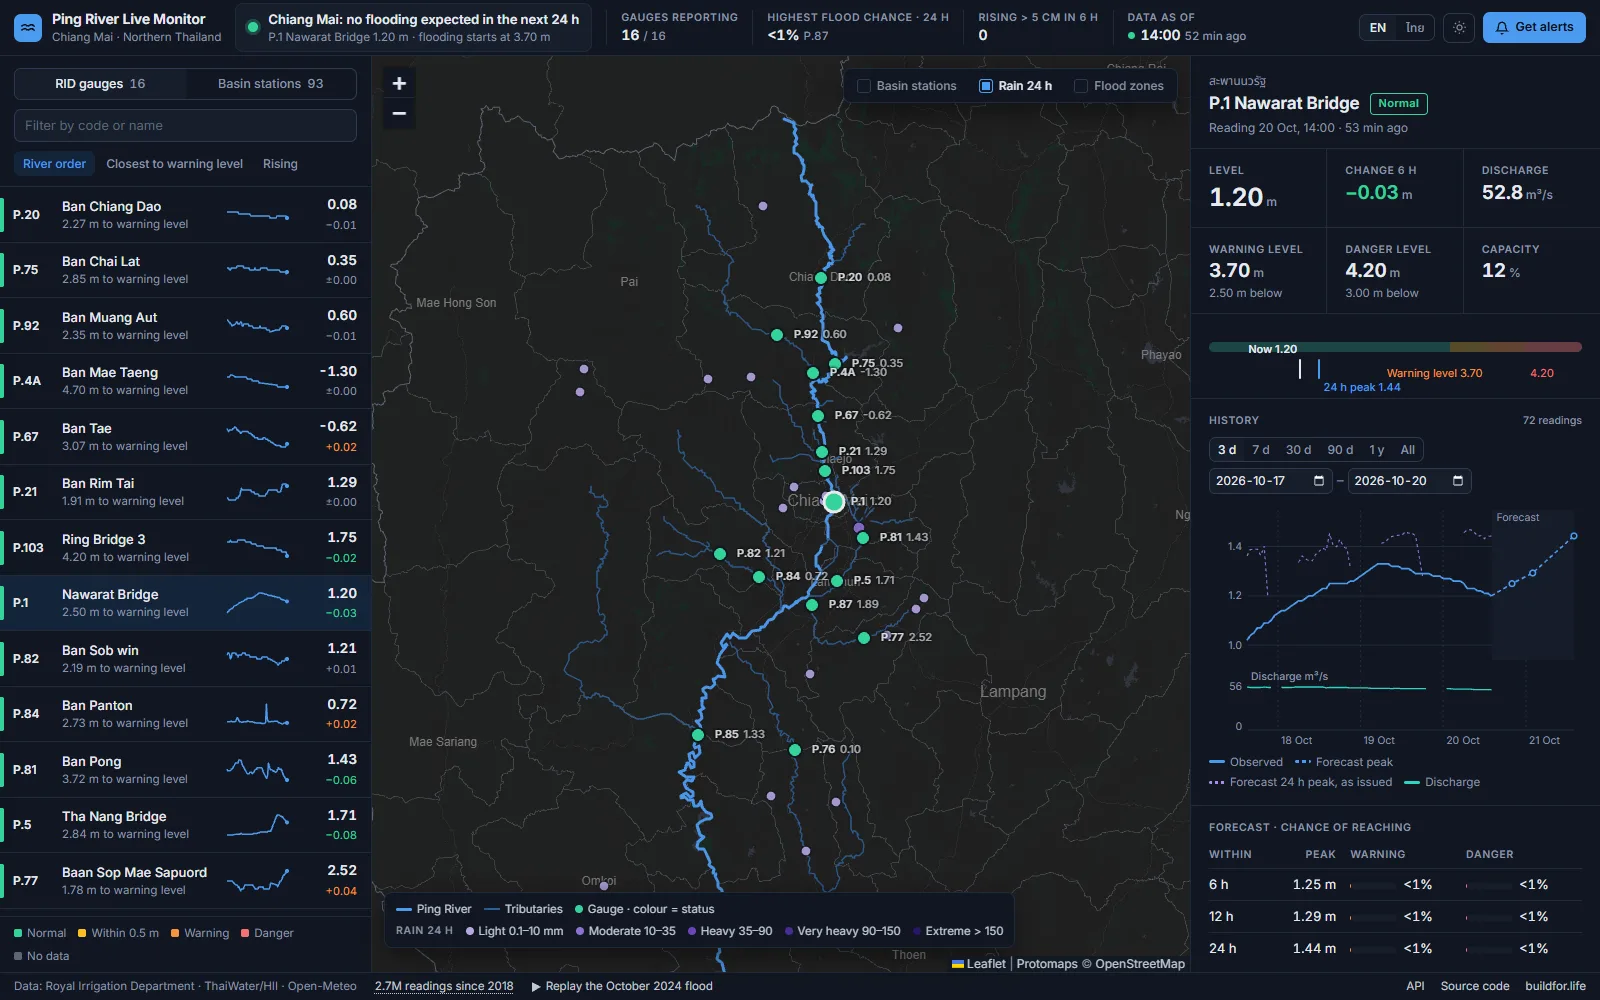 The new console on October 20. Nawarat Bridge at 1.20 m, 2.50 m below the warning level, all sixteen gauges reporting, the highest 24-hour flood chance in the basin under 1%.
In September we wrote about the model behind our Ping River monitor: gradient-boosted trees, public gauges, rain forecasts, and thirteen hours of warning on the 2024 flood in a backtest. This post is about everything around the model. Between October 17 and 20 we replaced both the service that runs water.buildfor.life and the page people look at. The Python web service became one Rust program, and the dashboard became a console. The forecasts were not supposed to change, and making sure of that was most of the work. One of them did change anyway, because the rewrite found a bug in the forecast we had been serving since August.
What was there
The old service was a FastAPI application running in several worker processes. One worker was elected leader and also did the collecting: it polled the Royal Irrigation Department (RID) every hour, along with the Hydro-Informatics Institute’s ThaiWater network, the RID dam report and Open-Meteo, then ran the forecast and sent the notifications. The other workers learned what the leader had done from a status file. That arrangement caused a whole class of bugs where the answer depended on which worker you happened to reach. The service used 324 MB of memory. It also carried database adapters for SQLite, MySQL, InfluxDB and VictoriaMetrics, but production only ever used PostgreSQL.
Before touching anything we wrote down whether a rewrite was worth doing (docs/RUST_REWRITE.md). Performance was explicitly not a reason. The forecast took 158 ms per station in Python and 0.25 ms in Rust, but it runs once an hour, and load tests had shown that once the caches are warm the site is limited by bandwidth. The reasons were operational: one process instead of an elected leader, a fraction of the memory, parsing and SQL checked by the compiler, and a single binary to deploy. The assessment advised against a big-bang rewrite. Each phase had to be useful on its own and possible to abandon.
Training stays in Python
No Rust library trains gradient-boosted trees the way scikit-learn’s HistGradientBoosting does, and the evaluation harness, where all the model work happens, is Python. So the split is: Python trains the models, in a monthly retrain on the same server, and exports each one as JSON, and Rust loads the trees and serves them. This has a cost that never goes away. Any feature added to the Python feature code has to be ported to Rust in the same change, or the new model is refused, and CI enforces this.
The split only works if the Rust forecast is the same forecast, not a close one. Tree models are strict about this. A split threshold in a trained tree is often exactly a value that occurred in the training data, so a feature that is off by one unit in the last place (one ulp) can send a row down the other branch and change the prediction. Porting turned up three traps of this kind:
- serde_json’s default float parser is one ulp off on some inputs. Its
float_roundtripmode is not. - pandas computes rolling sums and means with Kahan compensation and a shortcut for runs of equal values, and a plain running sum drifts away from it.
- pandas’
sort_valuesis not stable, so two readings from the same hour came out in whatever order the database returned them. We made the tie-break explicit on both sides.
To test the port, we generated fixtures by running the Python production functions on cached data, with only the database fetch replaced. Rust has to reproduce the features bit for bit, the predicted levels exactly, and the probabilities to within a few ulp (numpy’s exp and the C library’s differ in the last digit). Before each switch we also compared the two live, on production data: all 48 forecast rows were identical and all 96 probabilities bit-identical. The notifier was pinned with 751 messages recorded from the Python version and replayed word for word. The website and API went last. A script ran both servers against the same database and compared the routes, and all 53 compared routes matched, down to the JSON field order, Python’s rounding and FastAPI’s error format. Nobody using the API should have noticed the switch.
Even the configuration file needed this treatment. The Rust service and the Python training tools share one .env file. The usual Rust crate for reading it aborts on a quote inside an unquoted value, and prints the offending line, password included. We ported python-dotenv’s parser instead and checked it against 614 generated inputs.
The bug the rewrite found
Porting the feature code line by line turned up something no test had caught: the live forecast never saw the weather forecast. The feature rain_fc24, Open-Meteo’s predicted rain for the next 24 hours, is a forward sum, and the code cut the rain series to the span of the gauge readings before summing. The newest reading is the last row, so the row every live forecast is made from had nothing ahead of it to sum. Training and every evaluation had the real value. Live serving had “unknown”, from the day the rain features were added on August 12 until October 18.
The thirteen hours of warning in our September post come from the evaluation harness, which had the value, so they describe the model, not what we were serving. To measure the difference, we added a harness variant that blanks the feature on the test rows only, which is exactly what serving had been doing. The table covers all flood events in five monsoon seasons:
| Gauge | Median lead, fixed | As served | False alarms, fixed | As served |
|---|---|---|---|---|
| P.1 Nawarat Bridge | 7.5 h | 7.0 h | 0 | 0 |
| P.103 Ring Bridge 3 | 9.0 h | 9.0 h | 2 | 2 |
| P.21 Ban Rim Tai | 2.5 h | 2.0 h | 5 | 10 |
P.1 lost little, but P.21 doubled its false alarms. We fixed the Python first and then ported the fixed version. This is the second time we have caught the live system doing less than the evaluation says it does. The first, described in the September post, was a retrain that silently dropped the rain features. A second implementation that has to match the first exactly works as an audit of the first. We had not planned the rewrite as one.
One process
Since October 18 a single program, ping-collector, collects, forecasts, sends notifications over ntfy and Matrix, and serves the website and API. The leader election, the status file and the hand-off of the forecast between processes are gone. This afternoon /health reports 128 MB with all fifteen station models loaded, against 324 MB for the Python service. More than half of that is tree nodes, which we packed into one 24-byte struct each (70 MB for the fifteen models, against 140 MB as separate arrays). The cleanup commit deleted 19,578 lines, 12,577 of them Python: FastAPI, the collector, the command-line tool, the four unused database backends, the Docker and Grafana files, and the migration scripts once they had done their job. The service is now about 11,000 lines of Rust including tests. The remaining 7,600 lines of Python train, evaluate and backfill the archives.
Each phase went to production on its own, with a one-command rollback:
| Phase | Moved to Rust | In production |
|---|---|---|
| 1 | Collection: RID, ThaiWater, dams, Open-Meteo | Oct 17, 23:09 |
| 2 | Forecast and ntfy notifications | Oct 18, 15:08 |
| 3 | Website and API; Matrix gets the same alerts as ntfy | Oct 18, 16:40 |
| 4 | Python service code deleted | Oct 18 |
A detail for anyone talking to Thai government servers from Rust: the RID dam endpoint only offers TLS 1.2 with CBC cipher suites, which rustls refuses. We use the platform’s TLS (OpenSSL) instead.
Things that did not work
Our status notification topic told subscribers at midnight that the gauge feed was stale and at 07:00 that it had recovered, three nights in a row. RID publishes no hourly report overnight: the 21:00 reading is the last until the hours from 22:00 to 06:00 arrive together, between 06:30 and 07:30. The new notifier was meant to bridge the night with ThaiWater’s copies of the same gauges, on the assumption that they would be current. They are not, because ThaiWater relays the RID feed with the same delay. Now the feed of a quiet river is not reported stale between 21:00 and 09:00. While any gauge is at its warning level, or the Chiang Mai outlook is on, the three-hour rule still applies all night.
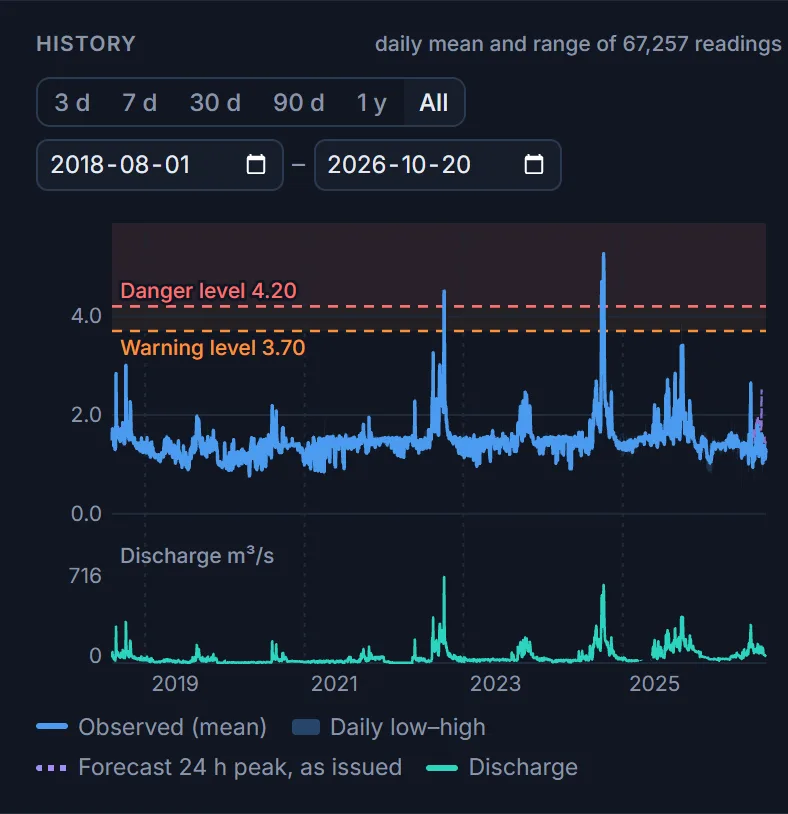
The old dashboard had a bug of its own, which we only found while replacing it. Its “All time” history for Nawarat Bridge ended in October 2024, because the history endpoint returns the oldest rows first and stops at 50,000 by default. P.1 has 67,257 hourly readings since August 2018.
The console
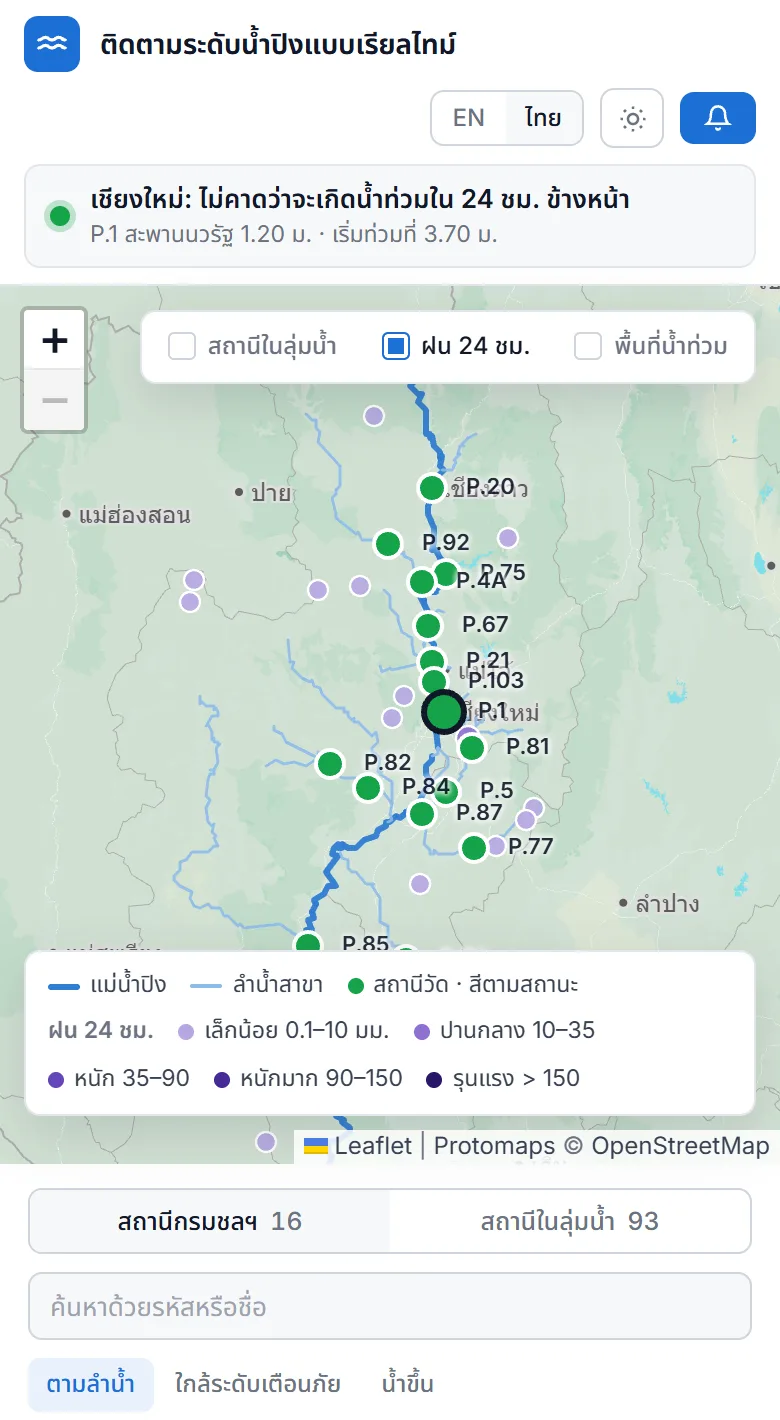
Before redesigning the page we looked at the old dashboard on a desktop and on a phone and wrote down what was wrong. Most visitors arrive with one question, “is Chiang Mai flooding?”, and the answer was a thin banner above four cards of equal weight. Two of those cards answered nothing a resident would ask: “most stressed gauge 16%”, and a river flow of “53.9” with no unit. Markers and river lines were colored by discharge, which answers “how much water”, not “how close to the warning level”. The basemap was OpenStreetMap’s raster tiles with Thai labels baked in, the legend covered about a third of the map, and on a phone the six header buttons, with emoji, wrapped into three rows.
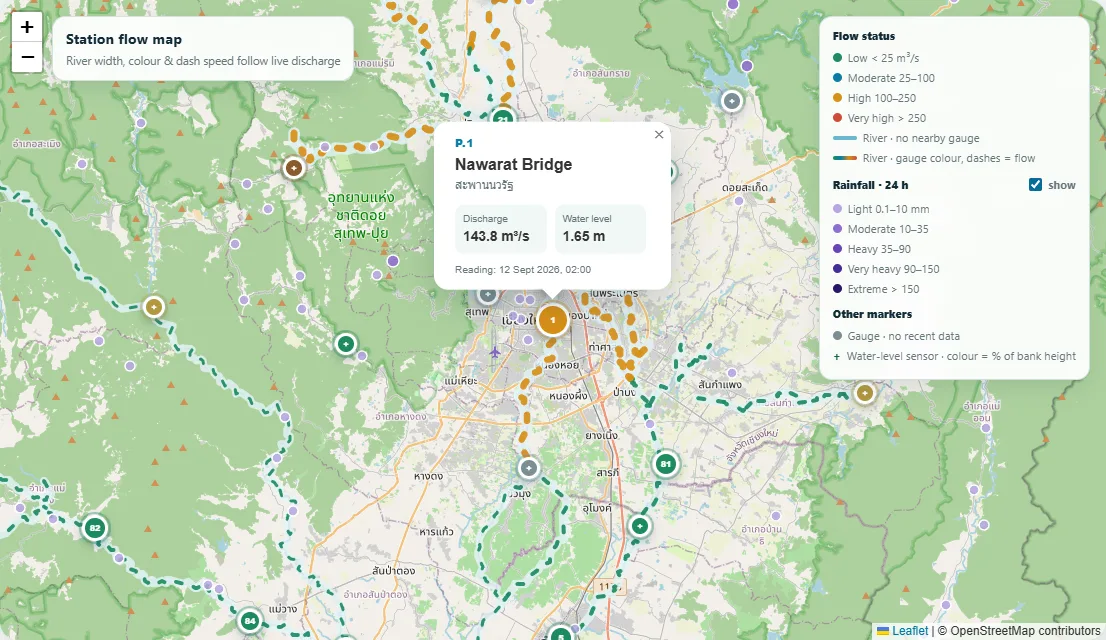 The old page, September 2026. Colors meant discharge, the basemap brought its own labels, and the legend took a third of the map.
We sketched two directions against live data, a public information page and an operations console, and chose the console. On a desktop it fits one screen with no scrolling. The top bar always shows the verdict for Chiang Mai, with the Nawarat Bridge level and the 24-hour forecast. On the left is every RID gauge with its distance to the warning level and a 72-hour sparkline. The map is in the middle, and the selected gauge is on the right with its readings, a history chart and the forecast table. The map, the list and the panel all use one status rule, and the colors mean status and nothing else:
| Status | Rule |
|---|---|
| Normal | none of the below |
| Watch | within 0.5 m of the warning level, or a 24 h chance of reaching it of 25% or more |
| Warning | at or above the gauge’s warning level |
| Danger | at or above its danger level |
| No data | no reading for 24 hours |
The basemap is now our own: a 15 MB vector extract of the Ping basin, built by Protomaps from OpenStreetMap data and served from the same machine, with labels in the language of the page. The fonts are self-hosted too. Alongside the sixteen RID gauges, a second list shows the ThaiWater and HII stations in the basin (93 this afternoon), each as a share of its bank height, the way ThaiWater classifies them. Every string exists in English and Thai, and a test fails if one is missing.
The history chart is plain SVG drawn by the page, with no chart library. Above 2,500 readings it draws the daily mean together with the daily low–high band, so a flood peak is not averaged away. It also breaks the line at gaps instead of bridging RID’s nightly pause, and “All” now asks for every reading.
We kept the October 2024 replay, and it now drives the whole console: the clock, the verdict, the list, the markers, the flood zones and the panel all follow the replay hour. A replay or a simulation must never look like live data. A violet REPLAY or amber SIMULATION bar spans the page, a mode pill in the top bar says which one is running, and a test fails if any label takes its mode from anywhere else.
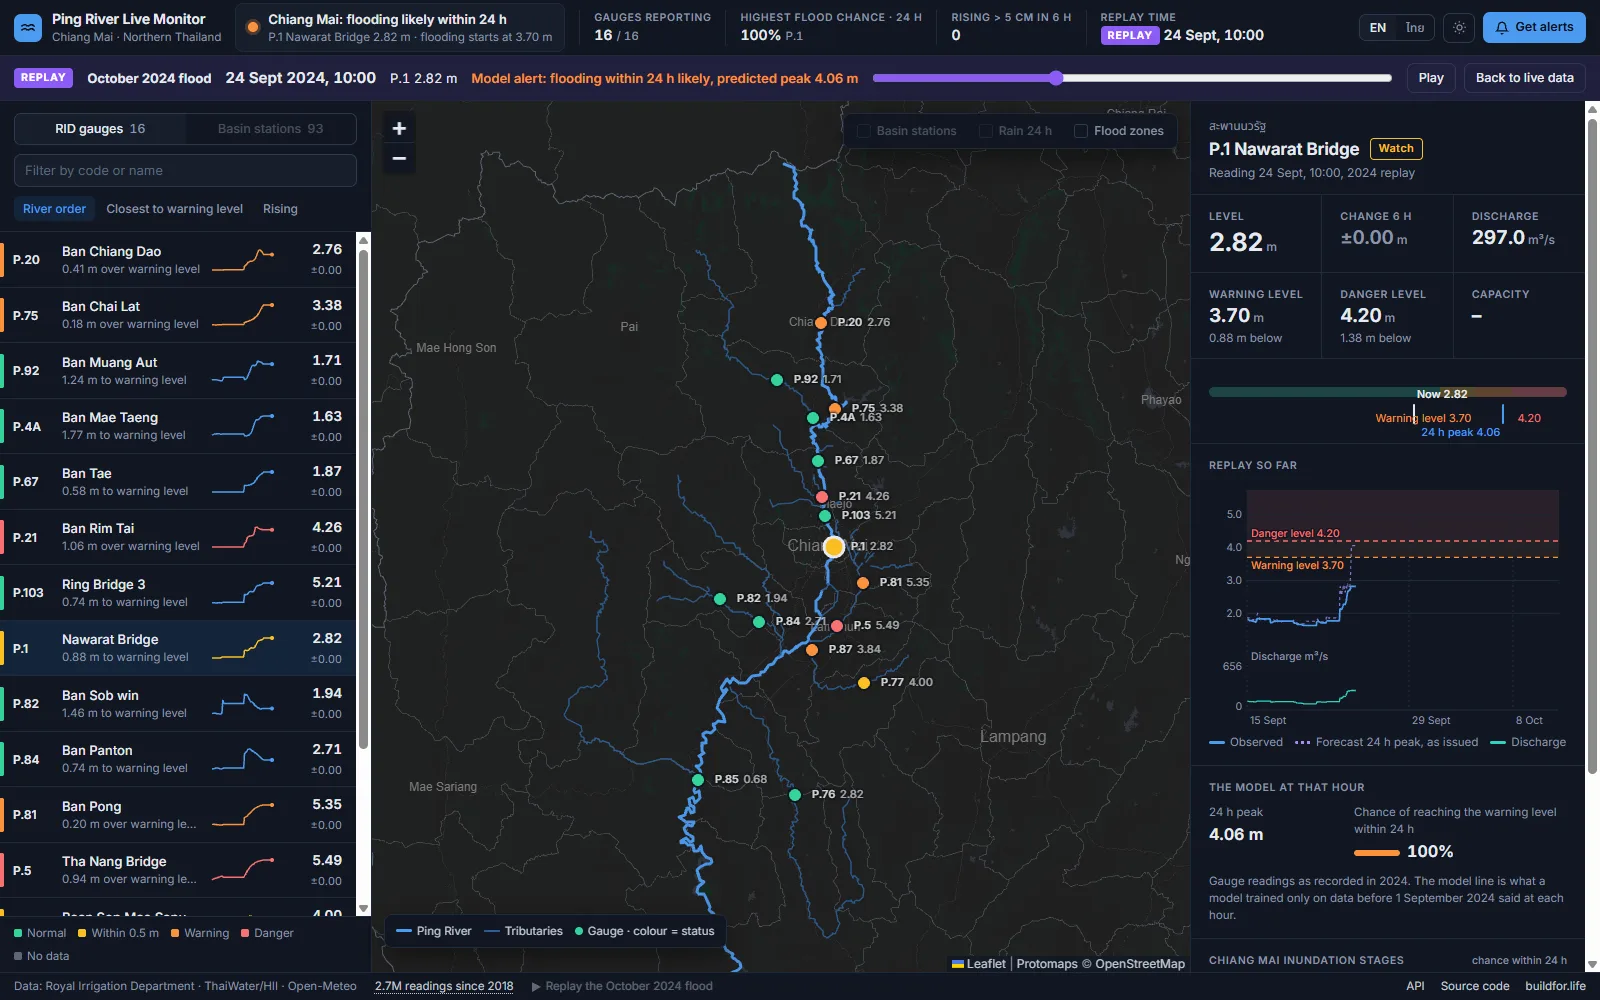 September 24, 2024, 10:00, replayed. Nawarat Bridge reads 2.82 m, seven hours before it crossed 3.70 m. The upstream gauges are already orange and red, and a model trained only on data from before September 2024 puts the chance of flooding within 24 hours at 100%, with a predicted peak of 4.06 m.
Still open: a pass over the phone layout, a review of the Thai by a native speaker, a keyboard and screen-reader pass, and Lighthouse scores of 90 or more.
Whose data, still
None of this changed where the data comes from. Everything still runs on the RID’s and the HII’s gauges and on Open-Meteo’s forecast model. We collect the data, store it, fill the gaps and forecast from it. Whether we add sensors of our own is still under evaluation, and the open question is still where a sensor would buy forecast lead, not whether we can build one.
Built with Claude, checked against the Python it replaced
Like the rest of the monitor, the rewrite and the console were built with Anthropic’s Claude under our direction. According to the commit history, the written assessment went in at 21:53 on October 17 and the last Python service file was deleted at 17:15 the next day. The console was sketched on the 19th and replaced the old page on the 20th. That pace is only safe when there is a reference to check against. Here the reference was the Python service itself, still running: fixtures from its production functions, live comparisons on production data before each switch, 751 recorded notifications, and a route-by-route comparison of the API. Wherever the port and Python disagreed, Python was the reference. When Python itself turned out to be wrong, we fixed Python first and then ported the fix.
Using it
The dashboard is at the same address, water.buildfor.life, and the API is unchanged. The interactive reference at /docs is now generated from the same route table that validates the requests, so the two cannot drift apart. Everything is MIT-licensed in the repository: the Rust service, the Python training stack, the parity tests and the console.
| Resource | Link |
|---|---|
| Live dashboard | water.buildfor.life |
| Repository | git.b4l.co.th/B4L/Northern-Thailand-Ping-River-Monitor |
| The rewrite: assessment, phases, parity method | docs/RUST_REWRITE.md |
| The console: design rules and phases | docs/DASHBOARD_REDESIGN.md |
| The model | Teaching a Model to See the Ping River Rise 13 Hours Early |
| API and data reference | buildfor.life/docs/tooling/ping-river-monitor |