Teaching a Model to See the Ping River Rise 13 Hours Early
In October 2024 the Ping River came into our lab. We knew it was coming, roughly, because everyone in Chiang Mai knew: the river was high, the news said it would get higher. What nobody could tell us was when, and how much. The official gauge at Nawarat Bridge crossed 3.70 m, the level where the city starts to flood, at 17:00 on 24 September. The water reached us the next morning. We spent that night moving instruments upstairs on a guess.
We build electronics, not hydrology. But the data to answer “when” and “how much” is public: the Royal Irrigation Department publishes hourly water levels for sixteen gauges on the Ping and its tributaries, and has done since 2018. Nobody had turned it into a forecast. So after the mud was cleaned out we did, and it has been running since: Ping River Live Monitor, open source at git.b4l.co.th/B4L/Northern-Thailand-Ping-River-Monitor.
What it shows
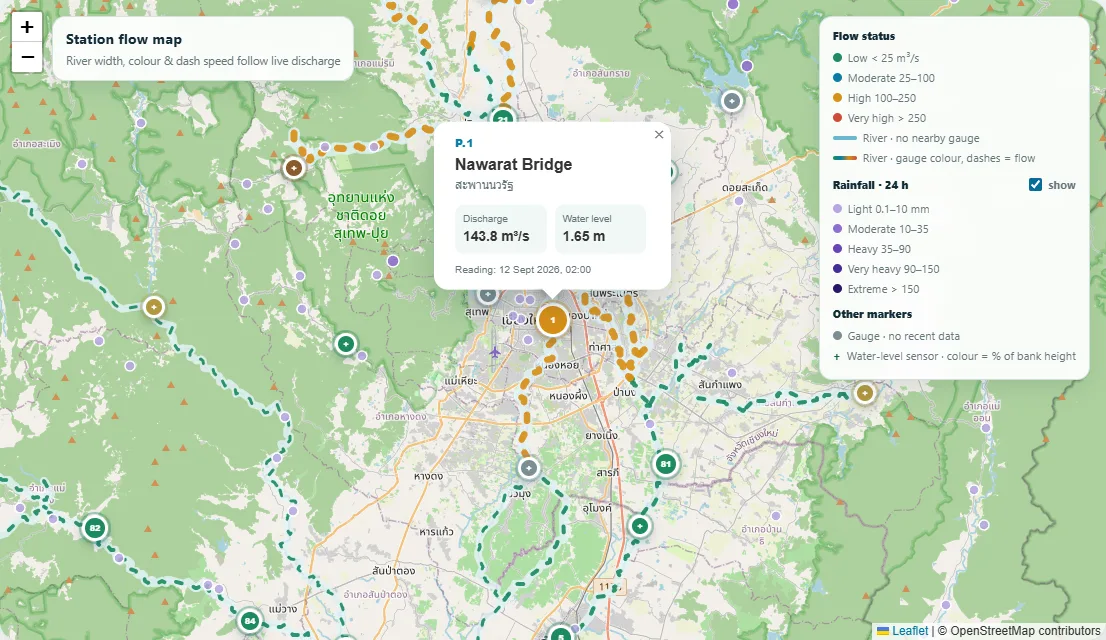 The river as a network, not a list. Each segment takes its width, colour and dash speed from the discharge at the nearest gauge; today the whole basin is running low. The purple dots are the last 24 hours of rain from about 130 ThaiWater gauges in the catchment.
The map is the part we spent the most time on that has nothing to do with forecasting. The RID gauges are points; the river between them is drawn from OpenStreetMap geometry and styled by the gauge upstream of each segment, so the picture reads like the river actually does. A flood wave takes 17 hours to travel from Chiang Dao (P.20) to Nawarat Bridge (P.1); on the map you can watch it come down. Under the map are the sixteen gauges, the Chiang Mai flood-zone polygons from the municipality’s inundation map with a stage per zone, a station history chart, and the forecast:
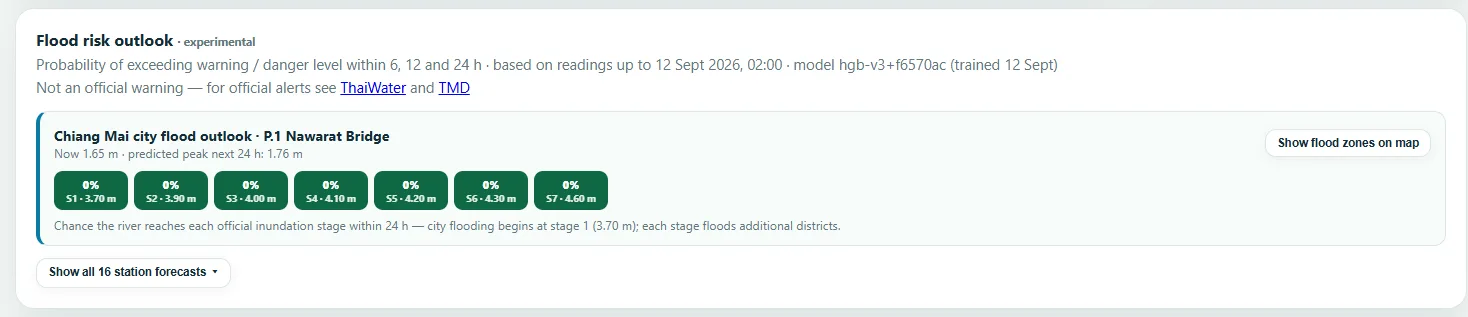 Today’s outlook for P.1: 1.65 m now, 1.76 m expected peak within 24 h, essentially zero probability of reaching stage 1. The seven stage chips are the municipality’s inundation stages from 3.70 m (first city flooding) to 4.60 m.
Every row of that card carries the model version and the training date, so a stale forecast is visible as a stale forecast, not disguised as a fresh one. That turned out to matter, and we will come back to it.
The data problem nobody mentions
The RID feed is hourly, but it is not there hourly. Across the sixteen gauges only about 56 percent of the hours in the eight-year record have a reading, and the gaps are not random: the fraction of days with a reading is 0.80 at 09:00 and 0.32 at midnight. That is a scraping schedule, not a river. One gauge, P.4A at Mae Taeng, was effectively dead from 2019 to 2024. Another lost 165 consecutive days in 2023.
We fixed most of it in two steps. The RID API will serve past days if you ask for them; the original scraper only ever asked for today, so a full-history re-fetch recovered most of the missing 44 percent and took coverage from 56 to 93 percent, 2.4 million rows today. The Hydro-Informatics Institute runs its own sensor at Nawarat Bridge and at a dozen other points on the same river, with an archive back to 2019, and that fills what RID never had. The first thing the fuller record did was correct our own history: the 2024 crossing was at 17:00 on the 24th, not 01:00 on the 25th as the sparse data had it. The eight hours in between had simply never been scraped, and the HII sensor at the same bridge confirmed the earlier time independently.
The point of mentioning this is that every number below was measured on the filled grid. Models evaluated on the sparse one looked better and were worse.
The model
We deliberately did not build anything exotic. Per gauge and per horizon (6, 12, 24 hours), a gradient-boosted tree model (HistGradientBoosting from scikit-learn) predicts how much the river will rise above its current level within the horizon. Rise, not absolute level: the absolute-level version we started with could not predict a peak higher than any in its training data, which is precisely the peak you want predicted. A separate classifier head estimates the probability of crossing each station’s warning and danger thresholds, and serving takes the worse of the two paths so an alert can never be quieter than the regression says it should be.
The features are what a hydrologist would write on a napkin. The gauge’s own recent history; the upstream gauges shifted by their measured travel time (we cross-correlated every gauge against P.1 to get the lags; the 17 hours from Chiang Dao is measured, not assumed); day of year; and, the thing that made the difference, rain.
Gauges tell you what has already happened upstream. To see further ahead you need to know what is falling on the catchment, and ideally what is about to fall. We use Open-Meteo for both: hourly precipitation at five points in the upper Ping catchment, from the same forecast-model archive back to 2021 for training and the live forecast at serving time. The forward 24-hour rain sum is a legitimate feature because at training time it comes from the archived forecast as it was issued that day, never from what actually fell.
Training runs in about twelve minutes on the same small VPS that serves the dashboard. No GPU anywhere.
Does it work
We test it the only honest way: train on data that ends before an event, then walk through the event hour by hour and record when the model would first have raised an alarm. Every evaluation in the repository is done that way, one fold per monsoon season, and the harness fails its own acceptance gate if the 2024 lead drops below twelve hours, so this page cannot quietly go stale.
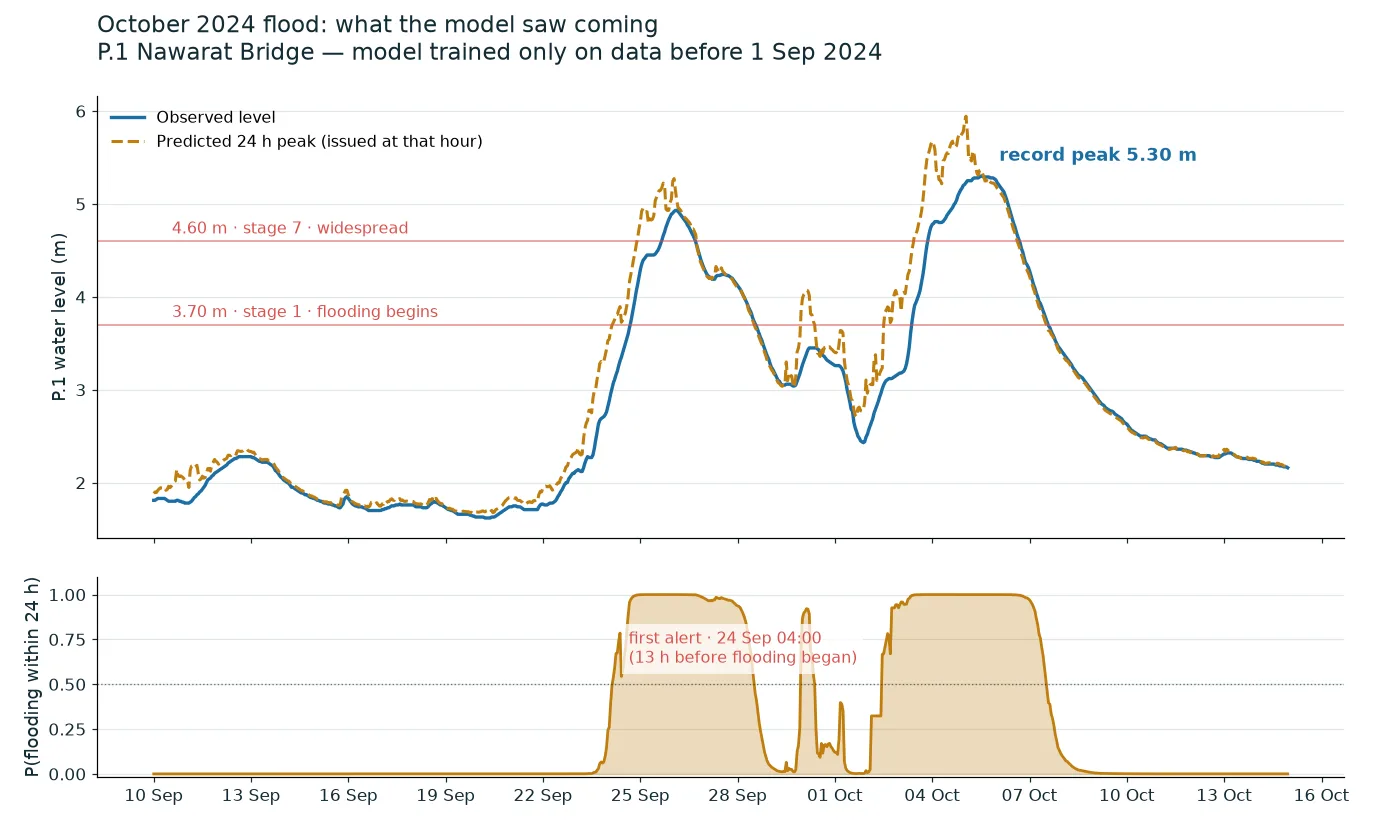 The 2024 flood, forecast cold by a model trained only on data through August 2024. Top: observed level (blue) against the 24-hour-ahead peak the model issued at each hour (amber). Bottom: probability of crossing 3.70 m within 24 h.
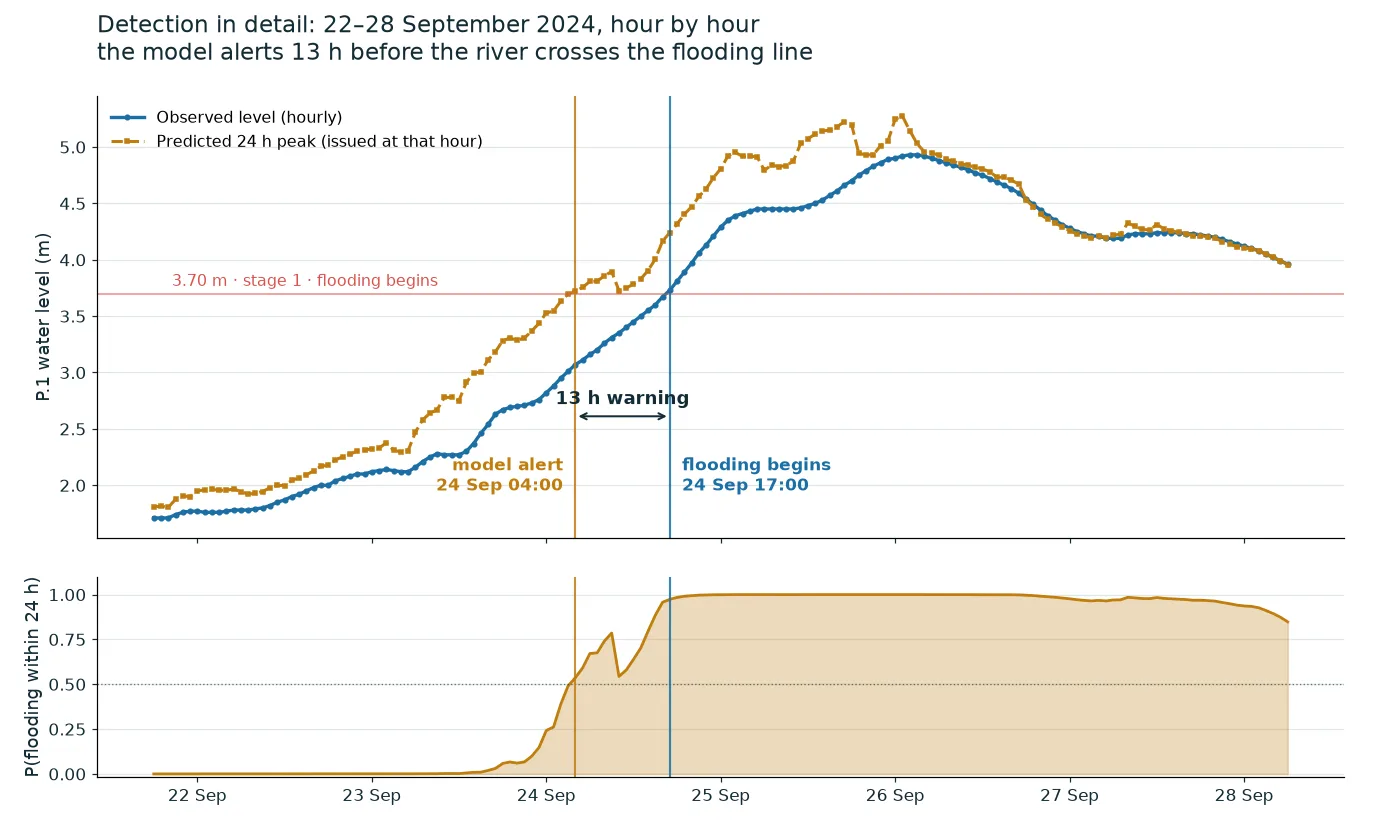 The detection window. First alert at 04:00 on 24 September, river at 2.9 m and looking ordinary. Crossing at 17:00. Thirteen hours.
Thirteen hours before the crossing that flooded our lab, with the river still reading 2.9 m in town, the model’s probability crossed 50 percent. The rain features did that: the catchment was already wet and more was forecast, and the model had seen that pattern before. The record 5.30 m peak on 5 October was tracked rather than capped, because the rise target does not care that no previous flood got that high.
For calibration we have the September 2025 flood, which peaked at 3.93 m, barely over the threshold. There the model alerted two hours ahead, and we think that is about right: a marginal crest is intrinsically a short-notice event, and an earlier version that “warned” 45 hours out was in fact an alarm that latched through a near-miss the day before. Two hours with zero false alarms across the season beats 45 hours of noise.
We are equally upfront about what it cannot do. Gauge-only physics caps lead time at the longest upstream travel time, 17 hours; rain is the only thing that extends past that, and the rain series only exists from 2021, so older floods in the training set are rain-blind. The danger head at P.1 (4.20 m) has never been tested out of sample because P.1 has not reached 4.20 m since we started evaluating. And a lead time measured on two floods is a lead time measured on two floods.
Whose sensors these are
Everything above runs on other people’s instruments. The water levels are the Royal Irrigation Department’s and the Hydro-Informatics Institute’s, the rain is Open-Meteo’s forecast model, and the gauge rain we now cross-check it against comes from the ThaiWater network. We are grateful these feeds are open, and we are also aware of what depending on them means: a gauge goes dark for 165 days and there is nothing we can do about it; the rain input is a model, not a measurement, and in the two weeks we have been comparing it against ~130 physical gauges in the catchment it has run about 45 percent wet.
Whether to add instruments of our own is the question we are still working through. We build long-lifetime, open hardware for a living, and a solar-powered water-level or rain sensor that reports over LoRa or cellular is well within what we do. The hard part is not the electronics; it is placement, maintenance, and knowing which of the network’s blind spots actually costs forecast lead. The evaluation harness can answer that last one: it tells us which stations’ gaps hurt, and the un-routed western tributaries with no upstream gauge at all are the obvious candidates. We would rather find out where a sensor is worth installing than install sensors because we can. If that turns into a device, it will be open like the rest.
Things that did not work
The repository documents the negatives as carefully as the positives, because the next person to try them should not have to. Feeding the model the Mae Ngat dam’s storage and outflow seemed obvious; it cost one to three hours of lead on every 2024 crossing, because the dam reports once a day with up to 31 hours of lag and during a fast onset the column describes yesterday’s benign reservoir. Quantile regression beat our squared-error model on average error and lost on lead time at five of eleven events. Average error is not the objective; lead is.
The failure we did not see
This week we checked the live server and found it serving forecasts from a model without the rain features. A retrain on 1 September had failed to reach the Open-Meteo archive, the training script had logged a warning and carried on with gauges only, and the dashboard reported the new, worse model as calmly as it had reported the old one. Thirteen hours of lead had silently become eighteen hours late, in the middle of monsoon season, for eleven days, with no error anywhere.
That is fixed: the trainer now refuses to run without rain unless you tell it explicitly that you want a gauge-only model, retrains happen monthly on a systemd timer, and the new bundles are only promoted after a check that they are what they claim to be. But it is the kind of failure worth writing down. The model version was in every API response the whole time. Nobody was reading it. Making a degraded state visible is not the same as making it noticed.
Built with Claude, checked against the river
Like our test bench and Fill Resistance, the monitor was built with Anthropic’s Claude under our direction, feature by feature. What keeps it honest is the same thing that keeps any of our tools honest: the evaluation is rolling-origin and event-based so a model cannot be graded on data it has seen, the acceptance gate is code, and the numbers in this post are the numbers the harness prints.
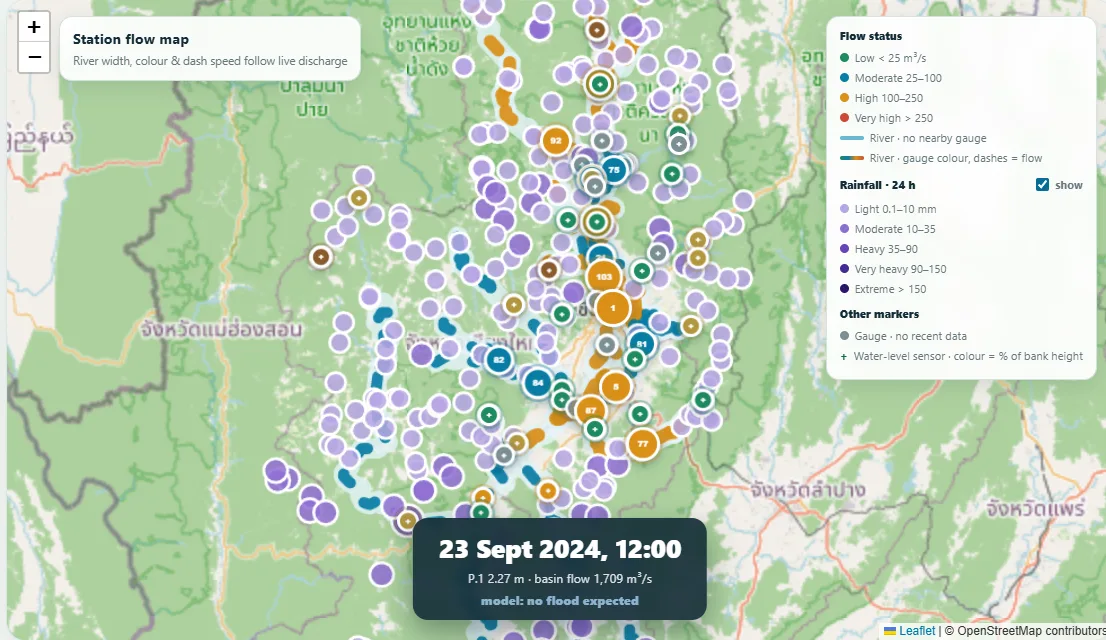 The dashboard’s “Replay Oct 2024 flood” feature, 23 September, noon. The river in town is at 2.27 m and the model says no flood expected. Look at the rain.
Using it
The dashboard is at water.buildfor.life, in English and Thai, and works on a phone. The API is open: /forecast returns the current outlook for every gauge, /measurements/history/P.1 returns the record. Everything, including the training scripts, the evaluation harness and the flood-zone data, is MIT-licensed in the repository.
| Resource | Link |
|---|---|
| Live dashboard | water.buildfor.life |
| Repository | git.b4l.co.th/B4L/Northern-Thailand-Ping-River-Monitor |
| API and data reference | buildfor.life/docs/tooling/ping-river-monitor |
| Forecasting write-up | docs/FLOOD_FORECASTING.md |
If you live along the Ping, we would like to know whether it is useful. If you run a gauge network, or want to, we would like to talk. And if you work with river data anywhere else, the whole approach transfers: public gauges, public rain forecasts, a small model, honest evaluation. There is nothing in it that only works in Chiang Mai.